FlyAtlas 2 – Gene
For a particular Drosophila gene, find the pattern of expression in different tissues.
Gene Symbol (e.g. vkg) — start typing, then select from the autosuggest menu
Gene Name (e.g. viking)
Annotation Symbol (e.g. CG16858)
Gene ID (e.g. FBgn0016075)
Transcript ID (e.g. FBtr0079036)
Gene Name (e.g. viking)
Annotation Symbol (e.g. CG16858)
Gene ID (e.g. FBgn0016075)
Transcript ID (e.g. FBtr0079036)
Gene:

| Adult Male | Adult Female | Male v. Female | Larval | |||||
|---|---|---|---|---|---|---|---|---|
| Tissue | FPKM | Enrichment | FPKM | Enrichment | M/F | p value | FPKM | Enrichment |
| Head | 1.1 ± 0.9 | N.A. | 1.2 ± 1.1 | N.A. | 1.00 | n.s. | ||
| Eye | 1.0 ± 0.2 | N.A. | 1.8 ± 0.4 | N.A. | 1.00 | n.s. | ||
| Brain / CNS | 0.7 ± 0.1 | N.A. | 1.3 ± 0.2 | N.A. | 1.00 | p < 0.05 | 1.3 ± 0.4 | N.A. |
| Thoracicoabdominal ganglion | 0.7 ± 0.2 | N.A. | 1.2 ± 0.3 | N.A. | 1.00 | n.s. | ||
| Crop | 0.6 ± 0.3 | N.A. | 1.8 ± 0.3 | N.A. | 1.00 | n.s. | ||
| Midgut | 1.0 ± 0.7 | N.A. | 0.7 ± 0.3 | N.A. | 1.00 | n.s. | 0.1 ± 0.2 | N.A. |
| Hindgut | 0.5 ± 0.2 | N.A. | 0.6 ± 0.2 | N.A. | 1.00 | n.s. | 0.3 ± 0.3 | N.A. |
| Malpighian Tubules | 1.8 ± 0.6 | N.A. | 1.7 ± 0.3 | N.A. | 1.00 | n.s. | 0.5 ± 0.6 | N.A. |
| Rectal pad | 2.3 ± 1.2 | 1.2 | 5.2 ± 0.3 | 2.6 | 0.45 | n.s. | ||
| Salivary gland | 2.0 ± 1.0 | 1.0 | 3.4 ± 1.1 | 1.7 | 0.60 | n.s. | 2.2 ± 0.5 | 1.1 |
| Fat body | 1.4 ± 2.4 | N.A. | 1.6 ± 2.7 | N.A. | 1.00 | n.s. | 0.7 ± 0.3 | N.A. |
| Heart | 0.4 ± 0.1 | N.A. | 0.5 ± 0.4 | N.A. | 1.00 | n.s. | ||
| Trachea | 2.2 ± 1.3 | 1.1 | ||||||
| Ovary | 0.4 ± 0.2 | N.A. | ||||||
| Virgin Spermatheca | 1.7 ± 1.5 | N.A. | ||||||
| Mated Spermatheca | 3.1 ± 2.0 | 1.6 | ||||||
| Testis | 0.1 ± 0.2 | N.A. | ||||||
| Accessory glands | 3.5 ± 1.0 | 1.7 | ||||||
| Carcass | 1.0 ± 0.4 | N.A. | 1.4 ± 0.1 | N.A. | 1.00 | n.s. | 1.0 ± 0.6 | N.A. |
| Garland cells | 0.0 ± 0.0 | N.A. | ||||||
| Whole body | 0.6 ± 0.3 | 0.7 ± 0.5 | 1.00 | n.s. | 0.4 ± 0.5 | |||

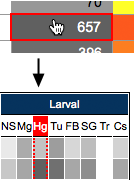
Rotate to see Transcript Table
| Transcript | Male | Female | Larval | ||||||||||||||||||||||||||||||||||||||
|---|---|---|---|---|---|---|---|---|---|---|---|---|---|---|---|---|---|---|---|---|---|---|---|---|---|---|---|---|---|---|---|---|---|---|---|---|---|---|---|---|---|
| Name | ID | Hd | Ey | Br | Tg | Cr | Mg | Hg | Tu | Rp | Sg | Fb | Ht | Ts | Ag | Cs | Hd | Ey | Br | Tg | Cr | Mg | Hg | Tu | Rp | Sg | Fb | Ht | Ov | Vs | Ms | Cs | Ns | Mg | Hg | Tu | Sg | Fb | Tr | Cs | Ga |
| RA | FBtr0343979 | ||||||||||||||||||||||||||||||||||||||||
These data are for a ncRNA (non-coding RNA), i.e. an otherwise uncategorized RNA that does not encode a protein.
RNAs below a certain size are not detected by RNAseq and therefore zero values for them will be false. Some longer RNAs overlap highly-expressed protein genes. It is therefore advisable to check any positive sequence reads for ncRNAs in the UCSC Genome Browser (link above). (N.B. Data for Fat Body and Spermatheca may not be comparable with those from other tissues.)
RNAs below a certain size are not detected by RNAseq and therefore zero values for them will be false. Some longer RNAs overlap highly-expressed protein genes. It is therefore advisable to check any positive sequence reads for ncRNAs in the UCSC Genome Browser (link above). (N.B. Data for Fat Body and Spermatheca may not be comparable with those from other tissues.)