FlyAtlas 2 – Gene
For a particular Drosophila gene, find the pattern of expression in different tissues.
Gene Symbol (e.g. vkg) — start typing, then select from the autosuggest menu
Gene Name (e.g. viking)
Annotation Symbol (e.g. CG16858)
Gene ID (e.g. FBgn0016075)
Transcript ID (e.g. FBtr0079036)
Gene Name (e.g. viking)
Annotation Symbol (e.g. CG16858)
Gene ID (e.g. FBgn0016075)
Transcript ID (e.g. FBtr0079036)
Gene:
| Adult Male | Adult Female | Male v. Female | Larval | |||||
|---|---|---|---|---|---|---|---|---|
| Tissue | FPKM | Enrichment | FPKM | Enrichment | M/F | p value | FPKM | Enrichment |
| Head | 11 ± 1.6 | 0.8 | 16 ± 5.9 | 2.0 | 0.70 | n.s. | ||
| Eye | 31 ± 2.9 | 2.1 | 26 ± 2.1 | 3.2 | 1.19 | n.s. | ||
| Brain / CNS | 4.1 ± 0.6 | 0.3 | 4.2 ± 0.5 | 0.5 | 0.99 | n.s. | 3.4 ± 0.1 | 0.6 |
| Thoracicoabdominal ganglion | 14 ± 4.5 | 0.9 | 12 ± 0.4 | 1.4 | 1.16 | n.s. | ||
| Crop | 2.8 ± 2.0 | 0.2 | 3.3 ± 0.9 | 0.4 | 0.85 | n.s. | ||
| Midgut | 22 ± 0.9 | 1.5 | 23 ± 4.1 | 2.8 | 0.93 | n.s. | 13 ± 2.6 | 2.1 |
| Hindgut | 26 ± 0.8 | 1.8 | 52 ± 8.2 | 6.3 | 0.51 | p < 0.05 | 66 ± 14 | 11 |
| Malpighian Tubules | 9.7 ± 0.6 | 0.7 | 8.4 ± 0.6 | 1.0 | 1.15 | n.s. | 4.6 ± 1.6 | 0.8 |
| Rectal pad | 3.8 ± 0.7 | 0.3 | 7.7 ± 2.8 | 0.9 | 0.50 | n.s. | ||
| Salivary gland | 86 ± 12 | 5.8 | 38 ± 6.7 | 4.6 | 2.3 | n.s. | 3.1 ± 1.4 | 0.5 |
| Fat body | 6.3 ± 1.7 | 0.4 | 4.1 ± 0.9 | 0.5 | 1.55 | n.s. | 0.8 ± 0.5 | 0.1 |
| Heart | 3.9 ± 1.2 | 0.3 | 3.8 ± 0.6 | 0.5 | 1.01 | n.s. | ||
| Trachea | 3.7 ± 0.5 | 0.6 | ||||||
| Ovary | 7.3 ± 0.3 | 0.9 | ||||||
| Virgin Spermatheca | 5.7 ± 2.2 | 0.7 | ||||||
| Mated Spermatheca | 4.8 ± 1.3 | 0.6 | ||||||
| Testis | 11 ± 0.4 | 0.7 | ||||||
| Accessory glands | 6.4 ± 1.1 | 0.4 | ||||||
| Carcass | 14 ± 2.0 | 0.9 | 11 ± 1.1 | 1.3 | 1.25 | n.s. | 4.4 ± 0.7 | 0.7 |
| Garland cells | 3.9 ± 2.2 | 0.6 | ||||||
| Whole body | 15 ± 1.8 | 8.2 ± 1.2 | 1.79 | p < 0.01 | 6.1 ± 1.0 | |||

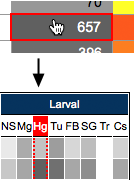
Rotate to see Transcript Table
| Transcript | Male | Female | Larval | ||||||||||||||||||||||||||||||||||||||
|---|---|---|---|---|---|---|---|---|---|---|---|---|---|---|---|---|---|---|---|---|---|---|---|---|---|---|---|---|---|---|---|---|---|---|---|---|---|---|---|---|---|
| Name | ID | Hd | Ey | Br | Tg | Cr | Mg | Hg | Tu | Rp | Sg | Fb | Ht | Ts | Ag | Cs | Hd | Ey | Br | Tg | Cr | Mg | Hg | Tu | Rp | Sg | Fb | Ht | Ov | Vs | Ms | Cs | Ns | Mg | Hg | Tu | Sg | Fb | Tr | Cs | Ga |
| RB | FBtr0086887 | ||||||||||||||||||||||||||||||||||||||||
| RC | FBtr0301202 | ||||||||||||||||||||||||||||||||||||||||
| RD | FBtr0340273 | ||||||||||||||||||||||||||||||||||||||||

*Tissue Comparability: See Docs for info on the chemistry used to sequence different tissues.
WARNING: Transcript Ambiguity for this Gene!
Because FlyBase assigns a unique transcript name and identifier for each unique protein, the rare cases in which such proteins result from alternative translation of the same mRNA give rise to situations in which there are two or more different identifiers for the same physical transcript. RNAseq analysis can only deal with unique sequences, and in such cases arbitrarily assigns the data from a sequence to one of the different transcript identifiers. The result is that some named transcripts will be missing, or data for some transcripts will actually include that for others. In the case of gene FBgn0028494 the situation is:
Because FlyBase assigns a unique transcript name and identifier for each unique protein, the rare cases in which such proteins result from alternative translation of the same mRNA give rise to situations in which there are two or more different identifiers for the same physical transcript. RNAseq analysis can only deal with unique sequences, and in such cases arbitrarily assigns the data from a sequence to one of the different transcript identifiers. The result is that some named transcripts will be missing, or data for some transcripts will actually include that for others. In the case of gene FBgn0028494 the situation is:
Data for FBtr0340273 include those for FBtr0452130 (gene FBgn0284231): Di- or poly-cistronic mRNA
No data for FBtr0086886 — included in FBtr0452131 (gene FBgn0284231): Di- or poly-cistronic mRNA
*** More extensive information about transcript ambiguity and its implications can be found in the Docs ***

