FlyAtlas 2 – Gene
For a particular Drosophila gene, find the pattern of expression in different tissues.
Gene Symbol (e.g. vkg) — start typing, then select from the autosuggest menu
Gene Name (e.g. viking)
Annotation Symbol (e.g. CG16858)
Gene ID (e.g. FBgn0016075)
Transcript ID (e.g. FBtr0079036)
Gene Name (e.g. viking)
Annotation Symbol (e.g. CG16858)
Gene ID (e.g. FBgn0016075)
Transcript ID (e.g. FBtr0079036)
Gene:
Symbol
mir-1013
mir-1013
Name
mir-1013 stem loop
mir-1013 stem loop
Annotation Symbol
CR43010
CR43010
Paralogues
No paralogues
No paralogues

| Adult Male | Adult Female | Male v. Female | Larval | |||||
|---|---|---|---|---|---|---|---|---|
| Tissue | TPM | Enrichment | TPM | Enrichment | M/F | p value | TPM | Enrichment |
| Head | 61 ± 13 | 1.5 | 51 ± 19 | 1.8 | 1.20 | n.s. | ||
| Eye | 56 ± 47 | 1.3 | 43 ± 41 | 1.5 | 1.30 | n.s. | ||
| Brain / CNS | 142 ± 25 | 3.4 | 151 ± 32 | 5.2 | 0.94 | n.s. | 73 ± 21 | 2.6 |
| Thoracicoabdominal ganglion | 101 ± 20 | 2.4 | 71 ± 0.0 | 2.4 | 1.42 | n.s. | ||
| Crop | 21 ± 30 | 0.5 | 0.0 ± 0.0 | 0.0 | 10 | n.s. | ||
| Midgut | 4.0 ± 5.0 | 0.1 | 3.0 ± 3.0 | 0.1 | 1.33 | n.s. | 25 ± 16 | 0.9 |
| Hindgut | 19 ± 7.0 | 0.5 | 23 ± 5.0 | 0.8 | 0.83 | n.s. | 47 ± 21 | 1.7 |
| Malpighian Tubules | 44 ± 6.0 | 1.0 | 85 ± 13 | 2.9 | 0.52 | p < 0.05 | 126 ± 16 | 4.5 |
| Rectal pad | 18 ± 6.0 | 0.4 | 58 ± 25 | 2.0 | 0.31 | n.s. | ||
| Salivary gland | 8.0 ± 14 | 0.2 | 27 ± 47 | 0.9 | 0.30 | n.s. | 81 ± 16 | 2.9 |
| Fat body | 0.0 ± 0.0 | 0.0 | 0.0 ± 0.0 | 0.0 | 1.00 | n.s. | 18 ± 10 | 0.6 |
| Heart | 0.0 ± 0.0 | 0.0 | 0.0 ± 0.0 | 0.0 | 1.00 | n.s. | ||
| Trachea | 28 ± 15 | 1.0 | ||||||
| Ovary | 19 ± 19 | 0.7 | ||||||
| Virgin Spermatheca | 3.0 ± 6.0 | 0.1 | ||||||
| Mated Spermatheca | 0.0 ± 0.0 | 0.0 | ||||||
| Testis | 116 ± 74 | 2.8 | ||||||
| Accessory glands | 101 ± 54 | 2.4 | ||||||
| Carcass | 88 ± 7.0 | 2.1 | 96 ± 6.0 | 3.3 | 0.92 | n.s. | 13 ± 10 | 0.5 |
| Garland cells | 0.0 ± 0.0 | 0.0 | ||||||
| Whole body | 42 ± 12 | 29 ± 5.0 | 1.45 | n.s. | 28 ± 30 | |||

Rotate to see Transcript Table
Transcripts
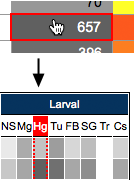
These data are for a microRNA.
The data were processed separately from those for other genes, and have different units and heat-map ranges.
There are only two possible transcripts for the microRNAs — the cleavage products RA and RB. The relative proportions of the two are represented by the area that they occupy in the transcript graphic, with an indication of the total abundance being provided by the colour intensity.
Adult crop, salivary gland, fat body, spermatheca and heart were sequenced using a different chemistry from the other tissues, as were larval Garland cells.